Hindsight Is 20/20. Foresight Isn’t

Dec 19, 2019
EQUITY INVESTING INVESTMENT PRINCIPLES
The year 2019 served up many examples of the unpredictability of markets.
The RBA expected the cash rate to stay steady or rise, but it fell instead. Sentiment around the residential property market started the year at an eight-year low with the prospect of potential changes to negative gearing on the horizon.1 Australian consumers’ confidence weakened as the year began,2 and news headlines broadcast fears of an economic slowdown. But investors who moved onto the sidelines may have missed the big gains in the Australian stock market. As of the end of October, the S&P/ASX 300 Index was up more than 20% for the year on a total-return basis. That puts it on course for the best showing since 2009, should it hold through December. Australian housing prices also rallied and are on track to post a positive gain for the year following reductions in the RBA cash rate, no changes to negative gearing policies and a loosening in loan serviceability policies from APRA.3
Outside Australia, Greece—the site of an economic crisis so dire some expected the country to abandon the euro earlier this decade, and a country whose equity market lost nearly a third of its value last year—has had one of the most robust stock market performances in 2019. On top of that, Greece issued bonds at a negative nominal yield, which means investors paid for the privilege of lending the government cash.
Taken as a whole, it’s a reminder that the prediction game can be a losing one for investors.
Up or Down?
A closer look at interest rates and bond markets around the world shows just how unpredictable asset performance can be. Going into 2019, the RBA expected no near-term adjustment in monetary policy, with the next move likely to be an increase in the cash rate.4 Instead, the RBA cut the cash rate three times throughout the year. It was a similar story in the US, with Federal Reserve officials expecting to raise rates, but instead lowering them three times.
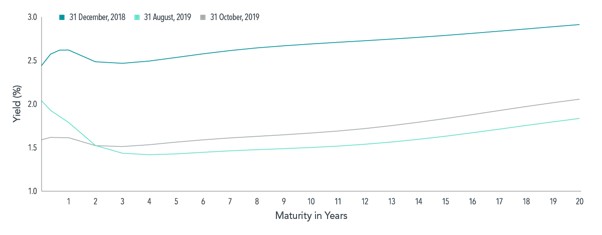
Globally, we have seen bond yields fall. In some markets, yield curves inverted (where long-term yields fall below short-term yields), including the US Treasuries market, which inverted for the first time in more than 10 years, as seen in Exhibit 1. Moreover, yields on medium- and long-term bonds were at historically low levels at the start of the year, but they fell even lower by the end of October. Investors who moved to cash based on the expectation yields would rise in 2019 may have been disappointed with how events ultimately transpired, with global bonds returning 7.71% for the year to 31 October 2019 while bank deposits earned less than 2% interest.5
EXHIBIT 1
Shifting Curves
Yields on US Treasuries of various maturities since the end of 2018
Trading Places
Events weren’t any
easier to anticipate in the global equity markets, where no evident link
appears between markets that performed well last year and those that have
excelled this year, as Exhibit 2 shows.
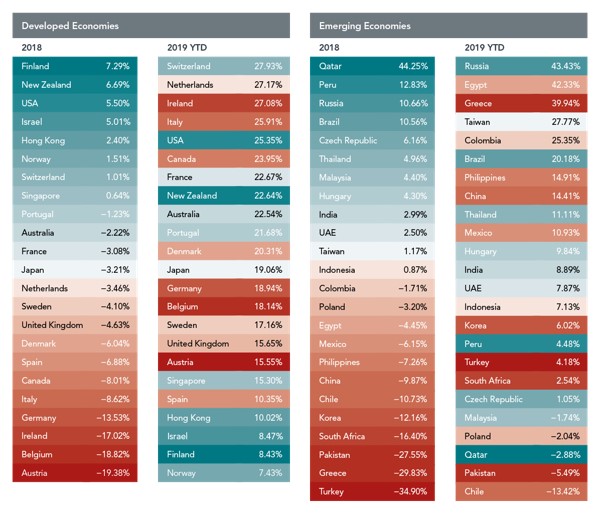
Among the 23 developed market countries,6 only one country was a Top 5 performer for
2018 and 2019: the US. Last year’s strongest performing market—Finland— ranked
22nd this year through the end of October. Among emerging markets, Greece
swung from a 30% decline last year to a 40% advance this year through the end
of October.
EXHIBIT 2
Changes in the Ranks
Performance of equity markets in 23 developed and 24 emerging economies
Perennial Wisdom
Careful research of historical returns has shown there’s no compelling or dependable way to forecast stock and bond movements, and 2019 was a case in point. Neither the mainstream prognostications nor recent hindsight predicted outcomes in 2019.
Rather than basing investment decisions on predictions of which way debt or equity markets are headed, a wiser strategy is to hold a range of investments that focus on systematic and robust drivers of returns. Investors who were broadly diversified across asset classes and around the globe were in a great position to enjoy the returns that the markets delivered in 2019. Last year, this year, next year—that approach is a timeless one.
FOOTNOTES
- 1Based on readings from the NAB Residential Property Index for Q4 2018.
- 2Based on readings from the Westpac-Melbourne Institute Index of Consumer Sentiment.
- 3Janda, M 2019, ‘Sydney, Melbourne house price surge accelerated in November’, ABC News, 2 Dec. 2019.
- 4Based on the December 2018 Minutes of the Monetary Policy Meeting of the Reserve Bank Board.
- 5Global bond returns measured by the Bloomberg Barclays Global Aggregate Bond Index (hedged to AUD). Bank deposit interest rates the average of interest rates between Jan. 2019 and Nov. 2019, sourced from RBA Statistical Table F4 – Retail deposit and investment rates; Savings accounts; Banks’ bonus savings accounts; $10,000.
- 6Markets designated as developed or emerging by MSCI.
DISCLOSURES
This material is issued by DFA Australia Limited (AFS License No. 238093, ABN 46 065 937 671). This material is provided for information only. No account has been taken of the objectives, financial situation or needs of any particular person. Accordingly, to the extent this material constitutes general financial product advice, investors should, before acting on the advice, consider the appropriateness of the advice, having regard to the investor’s objectives, financial situation and needs.
Indices are not available for direct investment. Their performance does not reflect the expenses associated with the management of an actual portfolio.
Past performance is not a guarantee of future results. Diversification does not eliminate the risk of market loss.
Source: Dimensional